Loading…
Loading…
Ranked by MissedTakes Score — how much better than a naive guess, not how often right. Someone who only ever picks the favorite lands near zero however high their accuracy climbs, which is the whole point of measuring it this way. The methodology explains the arithmetic. There is a ranking of publishers too, for when the byline is a masthead rather than a person.
Anyone with fewer than ten graded articles is left out of the numbered ranking. Thirty picks in one mock draft is one article, not thirty opinions, and counting it as thirty would be the quickest way to look established without having been tested.
296 awaiting a first graded take
ten graded articles or more
behind these numbers
| # | Pundit | MissedTakes Score | Accuracy | Graded |
|---|---|---|---|---|
| 1 | Lance Zierleinlimited sample | 47.39 | 64.77% | 43 |
| 2 |
Perfect clarity · 89 punditsevery graded claim was specific enough to check
Nick Pedone11Matt Hasselbeck10Brandon Anderson19Chris Clark19Colleen Wolfe11Scott Kennedy10Zach Roberts55Joel Klatt15Dylan Sanders12Brendan Donahue18Ayrton Ostley17Matt Miller52Matt Harmon13Scott Bogman43Dave Wannstedt
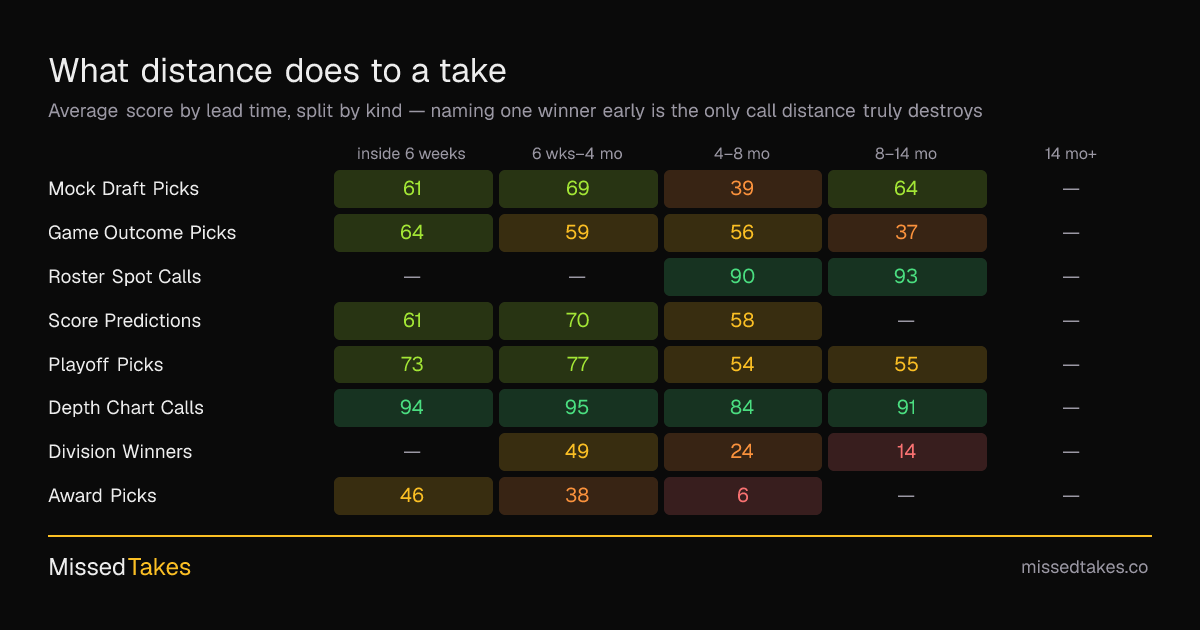
| inside 6 weeks | 6 wks–4 mo | 4–8 mo | 8–14 mo | 14 mo+ | |
|---|---|---|---|---|---|
| Mock Draft Picks | 61 | 69 | 39 | 64 | — |
| Game Outcome Picks | 64 | 59 |
Takes in each band
| 45.81 |
| 77.56% |
| 169 |
| 3 | Derek Brownlimited sample | 38.68 | 65.73% | 105 |
|---|
| 4 | Peter Schragerlimited sample | 36.37 | 69.28% | 50 |
|---|
| 5 | Pat Fitzmauricelimited sample | 35.95 | 58.21% | 161 |
|---|
| 6 | Ross Jackson | 33.23 | 66.56% | 231 |
|---|
| 7 | Rich Hribarlimited sample | 32.68 | 68.79% | 64 |
|---|
| 8 | Brian Peacocklimited sample | 31.65 | 69.78% | 82 |
|---|
| 9 | Mike Rennerlimited sample | 29.78 | 57.9% | 124 |
|---|
| 10 | Bucky Brookslimited sample | 28.9 | 72.73% | 117 |
|---|
| 11 | Jamie Erdahllimited sample | 28.21 | 35.4% | 59 |
|---|
| 12 | Damonza Byrdlimited sample | 27.54 | 48.33% | 18 |
|---|
| 13 | Tom Pelisserolimited sample | 25.69 | 79.11% | 30 |
|---|
| 14 | Daniel Jeremiah | 25.59 | 72.94% | 276 |
|---|
| 15 | Chris Brockman | 21.29 | 58.55% | 288 |
|---|
| 16 | Shannon Sharpelimited sample | 20.27 | 64.8% | 32 |
|---|
| 17 | Rich Eisen | 20.14 | 59.61% | 463 |
|---|
| 18 | Kevin Wildeslimited sample | 19.59 | 42.75% | 19 |
|---|
| 19 | Richard Shermanlimited sample | 17.65 | 58.17% | 121 |
|---|
| 20 | Marcus Mosherlimited sample | 16.38 | 80.47% | 77 |
|---|
| 21 | Nick Wright | 16.01 | 59.6% | 445 |
|---|
| 22 | Kyle Brandt | 14.57 | 55.57% | 104 |
|---|
| 23 | Cynthia Frelundlimited sample | 14.51 | 61.08% | 124 |
|---|
| 24 | Andrew Ericksonlimited sample | 13.08 | 54.85% | 119 |
|---|
| 25 | JP Acostalimited sample | 12.42 | 53% | 141 |
|---|
| 26 | John Middlekauff | 12.23 | 60.95% | 113 |
|---|
| 27 | Jordan Dajanilimited sample | 11.96 | 59.37% | 34 |
|---|
| 28 | Colin Cowherd | 10.8 | 55.97% | 465 |
|---|
| 29 | Tyler Sullivanlimited sample | 9.72 | 50.82% | 51 |
|---|
| 30 | Gregg Rosenthal | 8.77 | 60.46% | 356 |
|---|
| 31 | David Harrisonlimited sample | 8.41 | 64.51% | 235 |
|---|
| 32 | Jason McIntyre | 6.75 | 61.78% | 114 |
|---|
| 33 | Pete Priscolimited sample | 6.44 | 56.18% | 61 |
|---|
| 34 | Manti Te'olimited sample | 5.22 | 35.09% | 65 |
|---|
| 35 | Jared Dubinlimited sample | 2.01 | 49.4% | 45 |
|---|
| 36 | Nick Shooklimited sample | 0.33 | 65.37% | 70 |
|---|
| 37 | Jonas Knoxlimited sample | -0.06 | 56.06% | 105 |
|---|
| 38 | Joe Pisapialimited sample | -4.36 | 73.82% | 21 |
|---|
| 39 | Chad Ochocinco Johnsonlimited sample | -7.32 | 40.58% | 33 |
|---|
| 40 | LaVar Arringtonlimited sample | -8.28 | 44.18% | 88 |
|---|
| 41 | John Breechlimited sample | -9.1 | 41.97% | 93 |
|---|
| 42 | Danny Parkinslimited sample | -9.53 | 54.99% | 99 |
|---|
| 43 | Brady Quinnlimited sample | -12.27 | 59.37% | 144 |
|---|
| 44 | Jeff Kerrlimited sample | -19.88 | 69.3% | 178 |
|---|
| 45 | Dan Patricklimited sample | -24.68 | 52.11% | 26 |
|---|
MissedTakes Score is how much better than a naive guess on the same claims — zero means no better, and it is the column the rank is built on. Accuracy is the average score of their graded calls out of 100, with no credit for difficulty. Graded is how many of their claims have been settled against real results — the evidence behind the other two.
“Score” weighs the evidence behind it, so one perfect article can’t sit above sixteen graded ones — “Raw score” is the same number sorted with no such weighting.
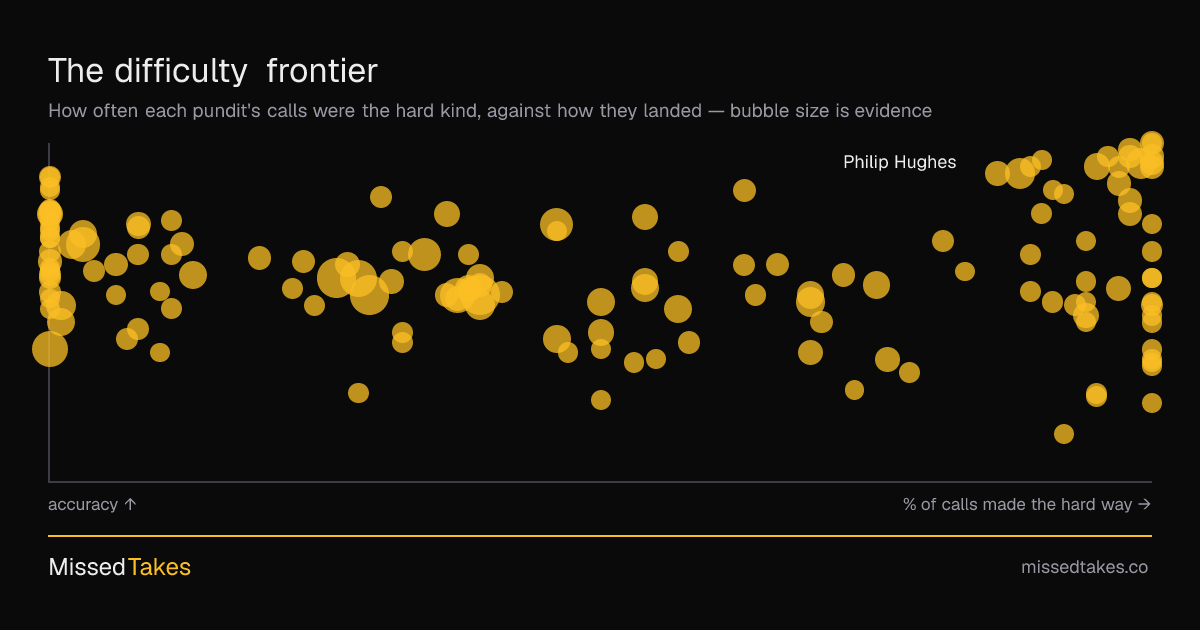
Everyone with ten or more graded calls. Bubble size is evidence, and the dot’s color blends the two axes — bluer means safer calls, golder means harder, brighter means more of them landed. Hover any point for its numbers, click through for the record behind it.
Showing the 30 most checkable of 60.
| 56 |
| 37 |
| — |
| Roster Spot Calls | — | — | 90 | 93 | — |
|---|
| Score Predictions | 61 | 70 | 58 | — | — |
|---|
| Playoff Picks | 73 | 77 | 54 | 55 | — |
|---|
| Depth Chart Calls | 94 | 95 | 84 | 91 | — |
|---|
| Division Winners | — | 49 | 24 | 14 | — |
|---|
| Award Picks | 46 | 38 | 6 | — | — |
|---|
| Season Win Totals | — | 63 | 50 | 44 | — |
|---|
| Positional Finishes | 37 | 39 | 33 | 34 | — |
|---|
| Conference Champions | 60 | 24 | 7 | — | — |
|---|
| Sleeper Calls | — | — | 55 | 44 | — |
|---|
| Trade and Signing Calls | — | — | 66 | 48 | — |
|---|
| Power Rankings | 79 | 74 | 60 | 64 | — |
|---|
| Super Bowl Picks | 54 | — | 4 | — | — |
|---|
| Player Season Numbers | 18 | 24 | 42 | 38 | — |
|---|
| Position Order Calls | 68 | — | — | 81 | — |
|---|
| Top Player Lists | 43 | — | 58 | 62 | — |
|---|
| Coach Award Picks | 37 | — | 5 | — | — |
|---|
| Pro Bowl and All-Pro Calls | 0 | — | — | — | — |
|---|
| Seeding, Byes and Home Field | — | 52 | 15 | — | — |
|---|
| Team Draft Slot Calls | — | — | 73 | 75 | — |
|---|
| Fantasy Rankings | — | — | 62 | — | — |
|---|
| Fantasy Bust Calls | — | — | 52 | 67 | — |
|---|
Cells are the average score of at least ten graded calls; an em dash means too few to say. Hover a cell for its sample size.